Forex Breakout & Forex Strategies Revealed

Intraday trading with pivot points

December 16, 2012
one of the most popular intraday trading tips is "use pivots to know when to entry and when to exit" today we are going to explore this tips, before we go deeper, we need to know what are these pivot points??

Pivot points  can be very useful tool for intraday trading, because of inherited simplicity and ease of usage , a large number of traders used it in past, using right now and we can safely assume , that they will be using in future too.

Pivot point is a basic mathematical calculation which lets the trader calculate the important levels of the stock price without any charts or indicator, since this needs just a tiny calculation and is easy to calculate and easy to apply, so this method is very popular among the day traders.

To calculate pivots points we will need the previous day’s open, high low and close values, and then we apply our formula to get the levels.

First of all, we need to pivot point itself, to do that, we need to add up high, low and close of previous day and then divide the sum by 3.

So, pivot point= (h+l+c)/3

Then we need to find first resistance, for this, we need to double the pivot point’s value and then subtract the low of previous day, so formula will be

Resistance 1= (2*pivot point) – low


Then comes the resistance level 2 or the second resistance, to get it, we need to add the difference of high and low with pivot point, so

Resistance 2 = pivot point + (high-low)


Now, we need to find supports, for this we will need to do the following calculations

Support 1= 2* pivot point- high of previous day and for support level 2,

Support 2=pivot point – (high-low)

 When a stock trades above pivot point it will be generally bullish and will face resistance at the resistance level 1 and 2

And when a stock trades below pivot points, will be generally bearish and will find supports at support level 1 and 2.


This way we can easily calculate the basic trend of a stock and its possible support and resistances.


Kicking Bearish

June 5, 2011
PATTERN:CONTINUATION

TREND: BEARISH

RELIABILITY: HIGH

How to identify it:

·  The first day is a White Marubuzo day

·  The second day is a Black Marubuzo day that gaps downward 

What it Means:

This pattern is a strong sign that the market is headed downward. With this indicator, the

previous market direction is not as important as with other indicators. 


Continue reading...
 

Shooting Star / Grave Stone Doji Bearish

June 5, 2011
PATTERN: REVERSAL

TREND: BEARISH

RELIABILITY: LOW /

MODERATE


 How to identify it:
·  Small real body at the lower end of the trading range

·  Prices gap open

·  Upper shadow usually at least three times as long as the real body

·  No (or almost no) lower shadow

What it Means:

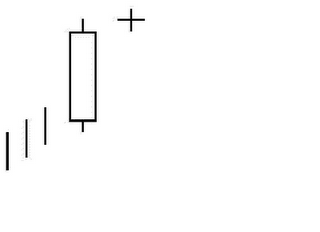
The market gaps open above the previous day's close in an uptrend. It rallies to a new high

then loses strength and closes near its low: a bearish change of momentum. Confirmation

of the trend reversal would by an opening below ...

Continue reading...
 

Falling Three Methods Bearish

June 5, 2011
PATTERN:CONTINUATION

TREND: BEARISH

RELIABILITY: HIGH


 How to identify it:
·  The first day is a long black day

·  The second, third, and fourth days have small real bodies and follow a brief uptrend

pattern, but stay within the range of the first day

·  The fifth day is a long black day that closes below the close of the first day

What it Means:

In a downtrend, a long black day occurs, following by three days of small real bodies that

fall into a short uptrend. On the fifth day, the bears come in s...

Continue reading...
 

: Evening Star Bearish:

June 5, 2011
PATTERN: REVERSAL

TREND: BEARISH

RELIABILITY: HIGH

How to identify it:

·  First day is a long white day

·  Second day is a small day that gaps in the direction of the previous trend

·  the third day is a black day 

What it Means:

In an uptrend, the market builds strength on a long white day and gaps open on the second

day. However, the second day trades within a small range and closes at or near its open.

This scenario generally shows an erosion of confidence in the current trend. Confirmation

of the...

Continue reading...
 

Evening Doji Star Bearish

June 5, 2011
PATTERN: REVERSAL

TREND: BEARISH

RELIABILITY: HIGH

How to identify it:

·  First day is a long white day

·  Second day is a doji that gaps in the direction of the previous trend

·  The third day is a black day 

 What it Means:
In an uptrend, the market builds strength on a long white day and gaps open on the second

day. However, the second day trades within a small range and closes at or near its open.

This scenario generally shows an erosion of confidence in the current trend. Confirmation

of the tre...

Continue reading...
 

Engulfing Bearish

June 5, 2011
PATTERN: REVERSAL

TREND: BEARISH

RELIABILITY:MODERATE

How to identify it:

·  A long white day occurs

·  The second day is a black day that completely engulfs the real body of the first day 


 What it Means:
Occurring in an uptrend, the Engulfing depicts an opening at a new high, followed by a high

volume sell-off that closes at or below the previous day's open. This signifies that the

uptrend has been hurt and the bears may be gaining strength. The Engulfing indicator is

also the first two days of the...

Continue reading...
 

Hanging Man / Dragonfly Doji Bearish

June 5, 2011
PATTERN: REVERSAL

TREND: BEARISH

RELIABILITY:LOW/MODERATE

How to identify it:

·  Small real body at the upper end of the trading range

·  Lower shadow at least twice as long as the real body

·  No (or almost no) upper shadow 

 What it Means:
There is a sharp sell off after the market opens during an uptrend. However, by the end of

the trading day, the market closes at or near its high for the day. This signifies the potential

for further sell-offs. Since the certainty for a Hanging Man indicator is ...

Continue reading...
 

Doji Star Bearish

June 5, 2011
PATTERN: REVERSAL

TREND: BEARISH

RELIABILITY:MODERATE

How to identify it:

·  First day is a long white day

·  Second day is a doji that gaps in the direction of the previous trend

·  The shadows of the doji should not be long 


Continue reading...
 

Dark Cloud Cover Bearish

June 5, 2011
PATTERN: REVERSAL

TREND: BEARISH

RELIABILITY: High


How to identify it:

·  First day is a long white day

·  Second day is black with an open above the high of the previous day

·  Second day closes within but below the midpoint of the first day's body 

What it Means:

In an uptrend the market gaps open, but loses ground to fall below the midpoint of the

previous day. The Dark Cloud Cover pattern suggests an opportunity for the shorts to

capitalize on the next day's open: a warning sign to bullish inves...

Continue reading...
 

Recent Posts